The Five Types of A/B Test Decisions
Recently I wrote a blog post that mentioned “Superiority” as a type of A/B test decision. In this post I want to talk about all five types of A/B test decision that I think are relevant. This is an adaptation and extension of a talk I gave last year at the Quant UX conference (it’s a great event, you should check it out.) Note that I go into a little more statistical detail here, although most of the below is readable by non-data scientists.
A/B testing, or on-line controlled experimentation, is conceptually simple. Show half of your users a new experience, collect some data about their behavior, look at the data, then decide what to do. It can get tricky in the implementation details, but I want to focus here on the decision. The reason we do A/B tests is that we don’t yet know enough what the effect of this new experience will be, on user behavior and on our metrics, for us to make a decision. We’re uncertain. We need to reduce our uncertainty about the impact of the new experience, so that we can make a decision. The experiment will, if we’ve planned it right, give us enough confidence to make the right decision.
OK, but not all decisions are equal. Some will drastically affect users, cost real money, require teams of engineers to implement and support. Should you implement a deep-learning-based recommender system? Sounds expensive. You’d better know a lot about the impact of the change. Others are trivial. Should this button be green or blue? It doesn’t seem like the decision-making should be the same in both cases.
A/B testing, I think, should be thought of as a toolbox, a collection of approaches that are useful in different situations. Those approaches, the tools in the toolbox, are not just the statistical tests. They also include the process, including critical communication patterns.
As a data scientist supporting A/B tests, I’m constantly talking with stakeholders to get agreement on key aspects of each test – why we’re running the test, how we should measure success, and what thresholds we’ll use. Then, after I figure out how long we need to collect data, we go ahead and collect the data, analyze it, and, together, make a decision. Each tool, each type of decision, needs different approaches for these discussions.
Benn Stancil, co-founder of Mode, has argued that the most important goal for data people is to speed up decision-making in organizations. For A/B testing, there are lots of things we can do to speed up the process, most of them up front. Having clear, standardized ways to communicate can avoid surprises, reduce disagreements and let the team move on to the next thing promptly. And in some cases, understanding the motivation behind a test may even allow you to speed up the test itself.
In my experience, these 5 types of decisions cover most A/B testing scenarios.
- Superiority
- Bias-to-Ship
- Agnostic
- Measurement
- Lean Startup
Each decision is appropriate for a different scenario, a different motivation for running the experiment. Once everyone is aligned on why we’re running a test, with this framework, most of the rest of the process becomes details.
So let’s go through these decisions. In each case, I’m assuming you’re testing a New Experience versus the Control Experience, and have a single Key Metric that you care about that may be affected by this experience. To make it easy to follow, I describe when each decision is used, appropriate scenarios for this decision, how to plan for the experiment, and how to actually make the decision, once the data is in. Then, I provide some technical notes about the statistical approaches used in the planning and decision-making.
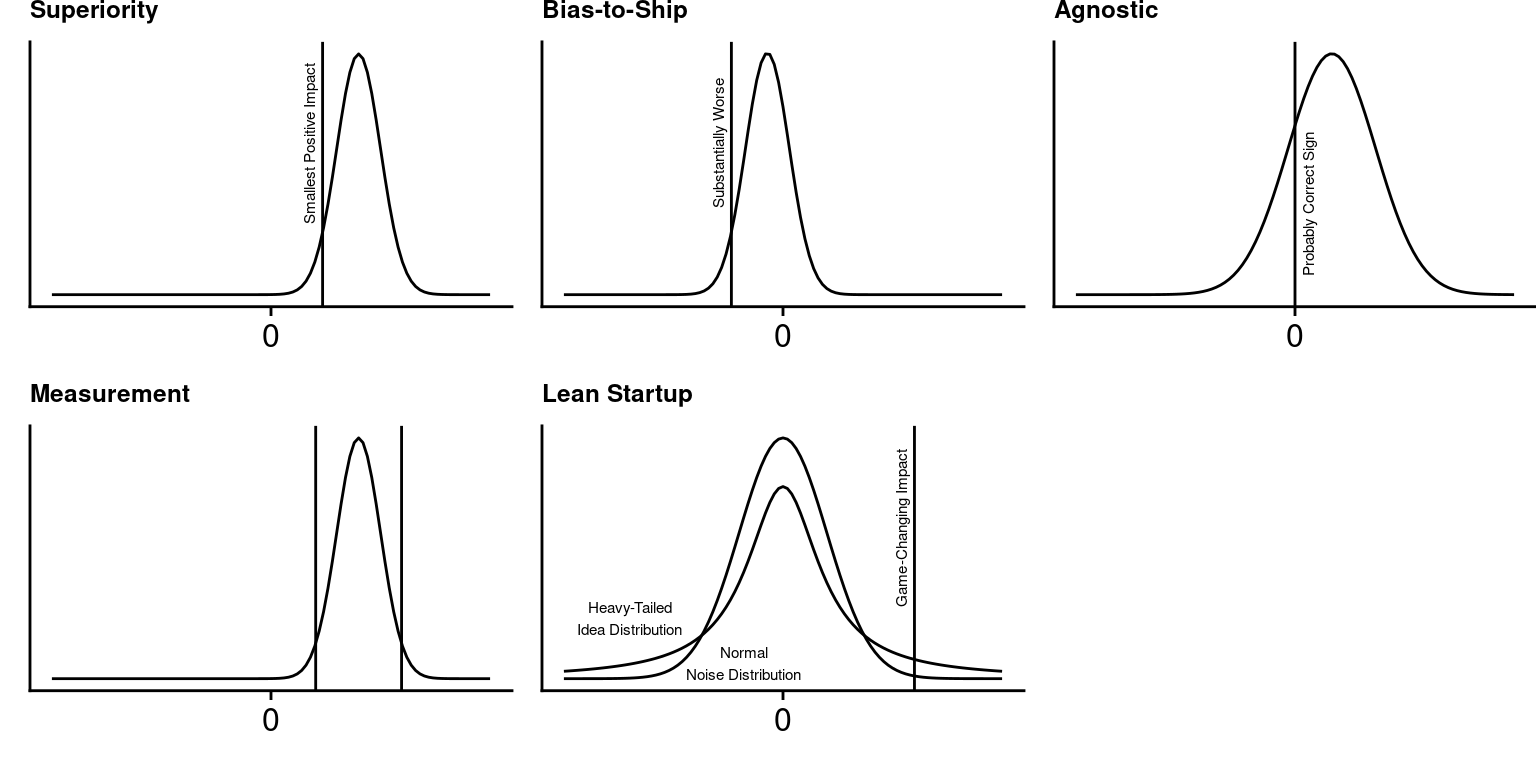
Figure: Perhaps-useful intuitions for the five types of decisions.
Superiority Decision
- Used When: You only want to roll out the New Experience if it is almost certainly better than the Control.
- Appropriate for: Changes that would be costly to fully implement and maintain, that would make your systems more complex. It’s a conservative test!
- Planning: Run the test until you’re quite likely to detect the smallest positive impact on the key metric that would cause a roll-out decision.
- Decision: Statistics say the New Experience is almost certainly better.
These are intuitions that data scientists, product managers, and others can share. We can agree, before a test, that this is the type of decision we’re making. Then, we can agree on particular quantitative thresholds for the italicized phrases.
For Superiority decisions, reasonable numbers might be: almost certainly = 95%, quite likely = 80%, smallest positive impact = 1%.
As I discussed previously,
for this decision, this ends up being essentially the same process as
classical null-hypothesis statistical testing. You can use standard statistical
methods to determine power, the length of time required to get enough data.
Then, when you get to the post-experiment analysis phase, you can use the
phrases from above again. Instead of confusing mathy jargon like p < 0.05,
we can instead say “It is almost certain that the New Experience is Better
than the control.” That’s what we agreed we needed to make a decision!
And when talking about the size of the impact, we can use phrases like “quite likely”, representing statistical uncertainty intervals, to help stakeholders understand the amount of uncertainty there is remaining. “The New Experience is quite likely between 0.3% and 0.7% better.” We’ve run the test to reduce our uncertainty, and have made a decision according to pre-determined criteria. Fantastic – let’s move on to the next test!
Bias-to-Ship Decision
- Used When: We want to roll out the New Experience unless it is plausibly substantially worse than the Control.
- Appropriate for: Changes that you want to make for non-metric reasons. A refactor or introduction of new technology that’ll be easier to maintain. A rebrand.
- Planning: Run the test until you’re quite likely able to rule out a bad outcome.
- Decision: Roll out unless statistics say the New Experience is plausibly substantially worse. Note that failure probably means “revise and retest”, not “abandon”!
For a Bias to Ship experiment, you want to be pretty sure a substantial negative impact won’t happen when you fully roll out the change. It turns out that the math for classical A/B testing is almost exactly symmetrical, and you can use the same approach as a Superiority decision, and just flip the sign. So instead of the smallest positive impact being 1%, the largest negative impact you can live with is -1%. Everything else is the same.
This approach is what Georgi Georgiev of the site Analytics Toolkit calls an “Inferiority Design”. It’s a commonly used technique particularly in medical statistics, but names for things matter, so I’d recommend calling this “Bias-to-Ship” instead.
Agnostic Decision
- Used When: You want to decide quickly while likely making the correct decision.
- Appropriate for: Cosmetic, no-cost decisions. Should the button be blue or green?
- Planning: Run until you’re likely to make the correct decisions, assuming you run many similar tests and have a sense of the range of potential impacts.
- Decision: Go with whichever variant is winning, by any amount. (!)
For an Agnostic experiment, the approach is a little different, and no longer resembles the NHST framework. Instead, I think a Bayesian approach makes sense. If you have been A/B testing changes to your web site for a while, you probably have a sense of the distribution of effect sizes that changes make. Most of the time they probably have little effect on your key metric, but occasionally a change is measurable and important. Your estimate of that is the prior distribution on the effect.
For the low-stakes tests in an agnostic experiment, you may not need to run with the same amount of power as you would for a Superiority decision – being reasonably confident (“likely” vs. “very likely”) is adequate. You also don’t care about the magnitude of the effect, you just want to be pretty sure you’re making the right decision (i.e., the estimated sign of the effect is correct, see Gelman & Carlin, 2014 and Inmbens, 2021).
By simulating many experiments, with effect sizes drawn from the prior distribution, and a range of experiment durations, you can identify how long you’d need to run the experiments to get most of the decisions (say, 80%) right. Then, there’s no need for a statistical test to be run at all once the experiment ends – you’ve already collected enough data to be adequately certain that the sign of the impact that you measured is on the correct side of zero. Very quick and easy decision!
Measurement “Decision”
- Used When: You aren’t making a decision – you already know you definitely will or will not make a change, but you want to be relatively precise in your estimate of the impact from the New Experience. Useful for learning, for guiding future designs, and for understanding the impact of past, untested changes.
- Planning: Run until you have the amount of uncertainty you want. E.g., relatively precise = ±2%
- Decision: N/A
For a Measurement quasi-decision, the statistical process may be similar to a Superiority design, but the communication is quite different. Saying “I want a measurement of the effect accurate within + or - 1%” is not that different from saying “I want to be able to detect a change of 1%.” (But note that this is a two-sided statement, while a Superiority design is usually one-sided.)
Lean Startup Decision
- Used When: You only want to roll out the New Experience if it is almost certainly MUCH BETTER than the Control. MUCH BETTER would change your organization and product direction dramatically, e.g. a 50% improvement in conversion!
- Appropriate when: Small impact is meaningless and should be ignored, as if you’re a startup trying to find product-market fit. You have many ideas, most won’t work, but one might be game-changing, and the only thing that matters is if you’ll find it or not.
- Decision: If you see a huge impact, it turns out that it’s more likely from a game changer vs. from noise!
A Lean Startup decision is a super-aggressive variation on a Superiority Decision. The statistics are the same as a Superiority design, but during the power analysis phase, the test is set up to be deliberately underpowered. Instead of the smallest positive impact that would lead to a roll-out, you only need enough power to detect an enormous, game-changing effect.
The intuition is that, of all the things you could be doing on your web site, most will have minimal impact, but a few of them might have a game-changing impact. Randomness, however, is less likely to cause such a big impact. (Formally, the distribution of impacts from changes is probably fat-tailed, compared to the normal distribution of random sampling error. See Azevedo et al., 2020 for a detailed analysis.) So if you do measure an unexpectedly big win, it’s probably real. Given this observation, you can run more high-risk high-reward experiments in less time, and hopefully find a game-changer.
So those are the five types of A/B test decisions. I have now introduced this framework at two different companies. In both cases, I found that the naming of these five types of decisions dramatically streamlined test setup and decision-making. If you take the time to implement something like this at your organization, please reach out! I’d love to hear how it went!