A/B Testing and Product Ratings, Part 1: Delays and Bias

Suppose you’re a data scientist at an e-commerce web site that sells shoes, responsible for supporting A/B tests. Many A/B tests are easy, and there are a number of companies that sell tools that make the easy cases as simple as clicking a few buttons and looking at pretty graphs. But A/B tests can get statistically complex surprisingly quickly, which is why hiring data scientists with a strong statistics background can make a big difference in the quality of decisions.
This is the first in a short series of blog posts about situations that can arise when testing changes that may affect product ratings, an important and ubiquitous part of e-commerce web sites. For certain changes to our site, we may want to understand not just whether users purchase more, but also whether they’re more satisfied with the items they purchase. You care a lot about satisfaction, as it’s closely tied to future purchase rate! There are several ways we could (and should) potentially measure this, such as return-to-site rate, complaint or refund rate, etc. But a direct way to estimate satisfaction is to look at the ratings that users provide.
However, when you’re making changes to an e-commerce site, your interventions can affect ratings in complex ways. This makes A/B testing tricky.
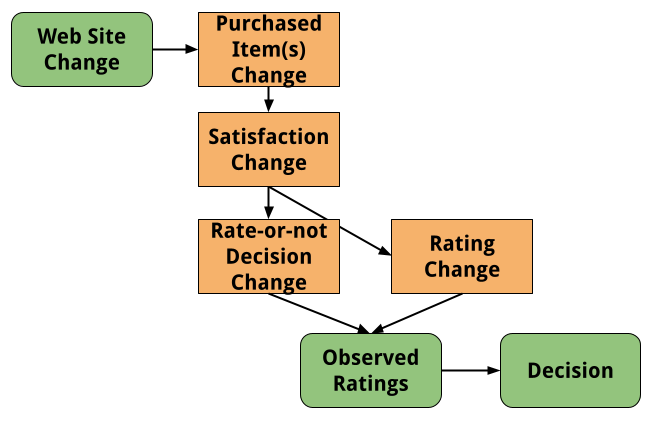
- The change could increase purchase rate or could change the mix of items purchased.
- The change could indirectly (via purchase rate or item mix), or even directly, affect the true satisfaction of items acquired. We cannot directly see true satisfaction!
- The change could directly or indirectly (via satisfaction) affect the rate at which items are rated, either by affecting peoples’ inclinations to rate at any time, or by changing the timing of ratings.
- The change could directly or indirectly (via the above factors) affect the rating given.
Put all of these together, and it’s clear that ratings are a proxy for satisfaction, not a direct measurement of satisfaction, and your decision-making process should treat the data accordingly!
Delayed and Biased Ratings
A challenge with ratings in e-commerce is not just that they’re an incomplete proxy, but they’re also delayed. If you order shoes from a web site, the earliest you’ll rate the item would be when you receive it, and more likely you’d rate it only after several days or weeks. And you might only rate it three months later, when you log back into the web site and are reminded of your past orders and prompted to rate them.
Furthermore, different people with different experiences differ in how they rate. Higher-priced items, where you spent a bunch of time reading reviews, might lead to a higher likelihood to rate. Items that were defective on arrival, or that were very disappointing, might lead to early, negative ratings.
Whatever you measure at the end of your A/B test is only an approximation to the eventual ratings that will trickle in, and even those ratings will be only an approximation of the true satisfaction of your customers. All of these complexities affect the validity of the signal you’re measuring.
Let’s do a quick simulation of the impact of these factors on ratings over time. We don’t need to have a realistic model for now, just a toy model to drive some intuitions. I’ll make this relatively simple:
- 10,000 people purchase a pair of shoes.
- Shoes are either cheap or expensive. Assume the purchase mix is 50/50.
- People can be unsatisfied, satisfied, or glowing about their purchase. If they rate, they’ll give 1, 2, or 3 stars, respectively.
- The cheap shoes are 20% likely to be unsatisfactory, and 20% likely to have the purchaser be glowing.
- The expensive shoes are 10% likely to be unsatisfactory, and 40% likely to have the purchaser be glowing.
- Assuming the shoes are satisfactory, people will rate the expensive shoes 20% of the time, and the cheap shoes 10% of the time.
- Assuming the shoes are satisfactory, and if they’ve decided to rate, people will rate early 50% of the time, and late 50% of the time.
- If the shoes are unsatisfactory or if the purchaser is glowing, the likelihood to rate doubles, and the likelihood to rate early increases to 75%.
- The early reviews might be what you see after running an experiment, while the later reviews might accumulate months later.
- There’s no need to simulate an A/B test for now, just the ratings over time.
Here’s some R code to simulate this. (Don’t worry if you don’t read R! It just implements the above and makes a graph of three views of the average rating.)
shoe_options = c('cheap', 'expensive')
sat_options = 1:3

sim_ratings <- function(ct=10000,
                        cheap_sat_prob=c(.2, .6, .2),
                        exp_sat_prob=c(.1, .5, .4),
                        rate_probs=c(.1, .2),
                        rate_mult=2,
                        late_probs=c(.5, .25)) {
  ret <- tibble(user=1:ct,
              shoes=sample(shoe_options, size=ct, replace=TRUE))

  ret %>%
    mutate(satisfaction=ifelse(shoes=='cheap',
                               sample(sat_options, size=ct,
                                      replace=TRUE, prob=cheap_sat_prob),
                               sample(sat_options, size=ct,
                                      replace=TRUE, prob=exp_sat_prob))) %>%
    mutate(rates_prob=ifelse(shoes=='cheap', rate_probs[[1]], rate_probs[[2]]) *
             ifelse(satisfaction != 2, rate_mult, 1)) %>%
    mutate(rates_late_prob=ifelse(satisfaction != 2,
                                  late_probs[[1]], late_probs[[2]])) %>%
    mutate(rates=rbinom(ct, 1, rates_prob),
           rates_late=rbinom(ct, 1, rates_late_prob))
}

sim1 <- sim_ratings()

res1 <- with(sim1, tribble(
  ~ name, ~value,
  "True", mean(satisfaction),
  "Early", mean(satisfaction[rates & !rates_late]),
  "Eventual", mean(satisfaction[as.logical(rates)])
))

theme_set(theme_minimal(base_size=16))

ggplot(res1, aes(name, value, label=sprintf('%0.2f', value))) +
  geom_point(size = 3, color = "black") +
  geom_segment(aes(x=name, xend=name, y=0, yend=value)) +
  geom_text(nudge_y=.15) +
  scale_y_continuous("Average", limits=c(0,3)) +
  coord_flip() +
  labs("Simulation 1: Parameters in Text",
       x="Rating")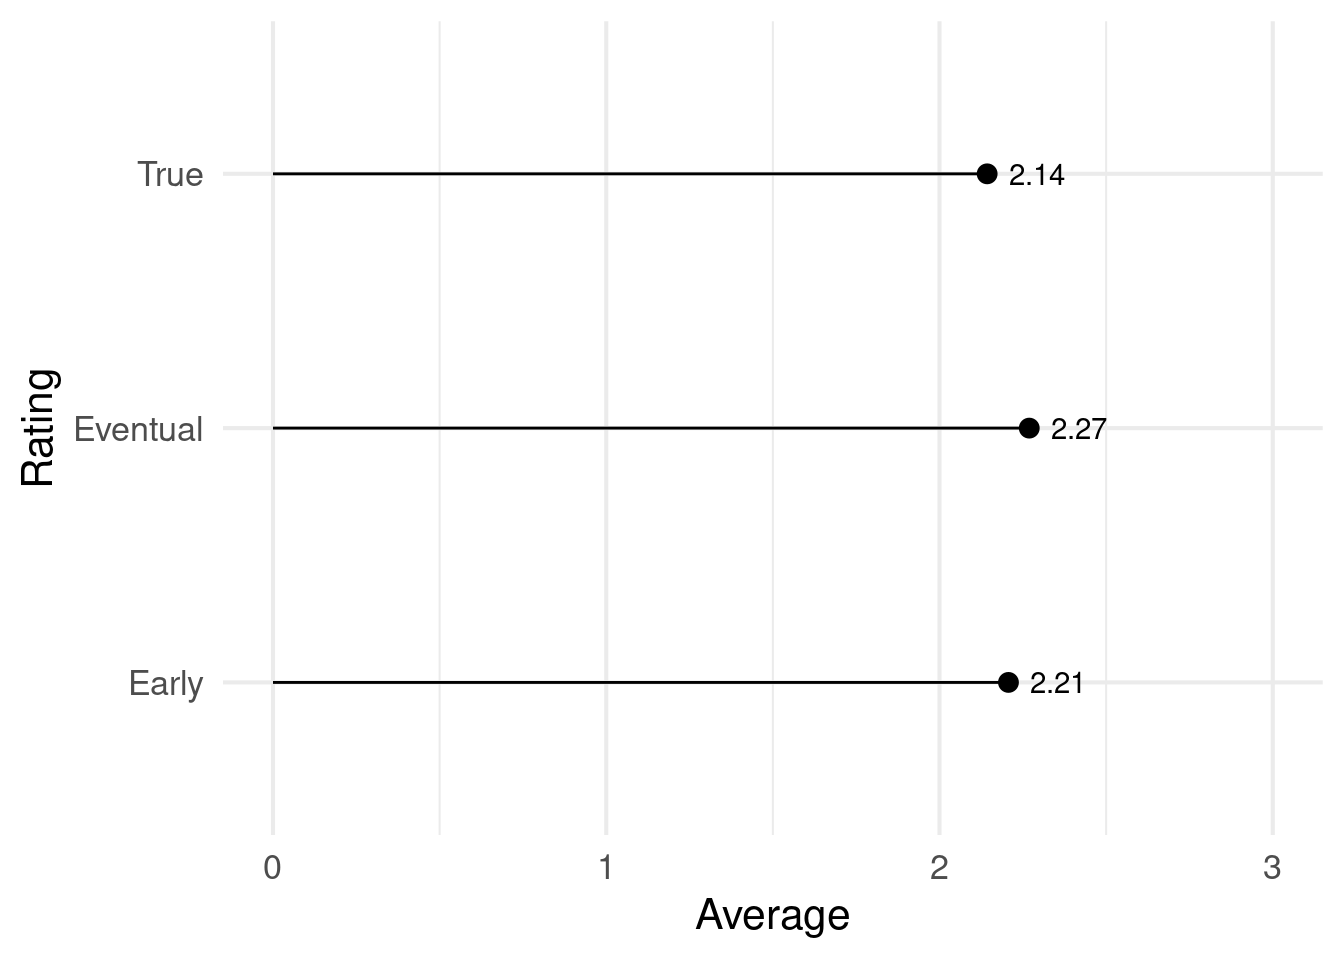
Here’s what I get out of these results, and thinking through the toy simulation.
- Ratings don’t reflect true satisfaction. In this simulation, only 22% of buyers will rate at all, and only 13% will rate early enough to be observed during an experiment.
- If there are more people who are glowing than dissatisfied, and if having strong feelings makes you more likely to rate, then ratings will look more positive than the actual level of satisfaction.
- Early ratings will differ from late ratings. In this scenario early ratings are a bit lower, as they reflect the more negative experiences of people who bought more expensive shoes but were dissatisfied.
Implications
So, what do we do about this? I don’t think there’s a one-size-fits-all answer. Not all e-commerce business are equal. A company that sells shoes might be lucky to have a 10% rating rate, while subscription services with very loyal customers, such as Rent the Runway or StitchFix, likely have much much higher rating rates. This said, here are some ideas for dealing with timing and low rating rates when ratings are a key metric for A/B tests:
- When doing a power analysis, before the experiment starts, be sure to use the number of people expected to rate during the experiment, not the much larger number of people expected to participate in the experiment.
- Look at historical rating patterns. In your specific case, do ratings accumulated in the first week or two differ dramatically from the eventual ratings, as in this simulation? The more that they do, the less valid metrics such as average rating will be, and the more work you should put in to ensure you’re making the right decisions about the feature.
- An easy thing to do is simply to wait. If you can, run the experiment longer, and wait longer after the experiment ends, accumulating more ratings, before you make a decision.
- Look at rating rates. If the intervention made users much more or less likely to rate at all during the window of your experiment, then the average ratings they provide are much less valid.
- Review your past experiments. If you re-analyze an experiment from 6 months ago, with most of the ratings that will eventually come in, do you get a different answer?
- Think about mechanisms. You may be tempted to A/B test an intervention where you remind people to rate their purchases a week after they receive their shoes. That test could easily yield a change in average ratings. But it’s important to remember that the change happened after the purchase decision, meaning there’s no way that the intervention caused a change in satisfaction with their purchase! (It still is likely a good idea, though!)
There are other issues that arise with A/B testing and ratings. A fun one is: what happens if users purchase more than one item? Are your statistical tests on ratings still valid? Turns out they’re not! In my next post on this topic, I’ll explain and provide a workaround!